Paraflow Debugger
The Paraflow Debugger, integrated as a VS Code extension, offers a seamless debugging experience for Paraflow actors within Visual Studio Code. It supports multi-actor debugging, enabling you to step through complex workflows as skill requests transition between actors.
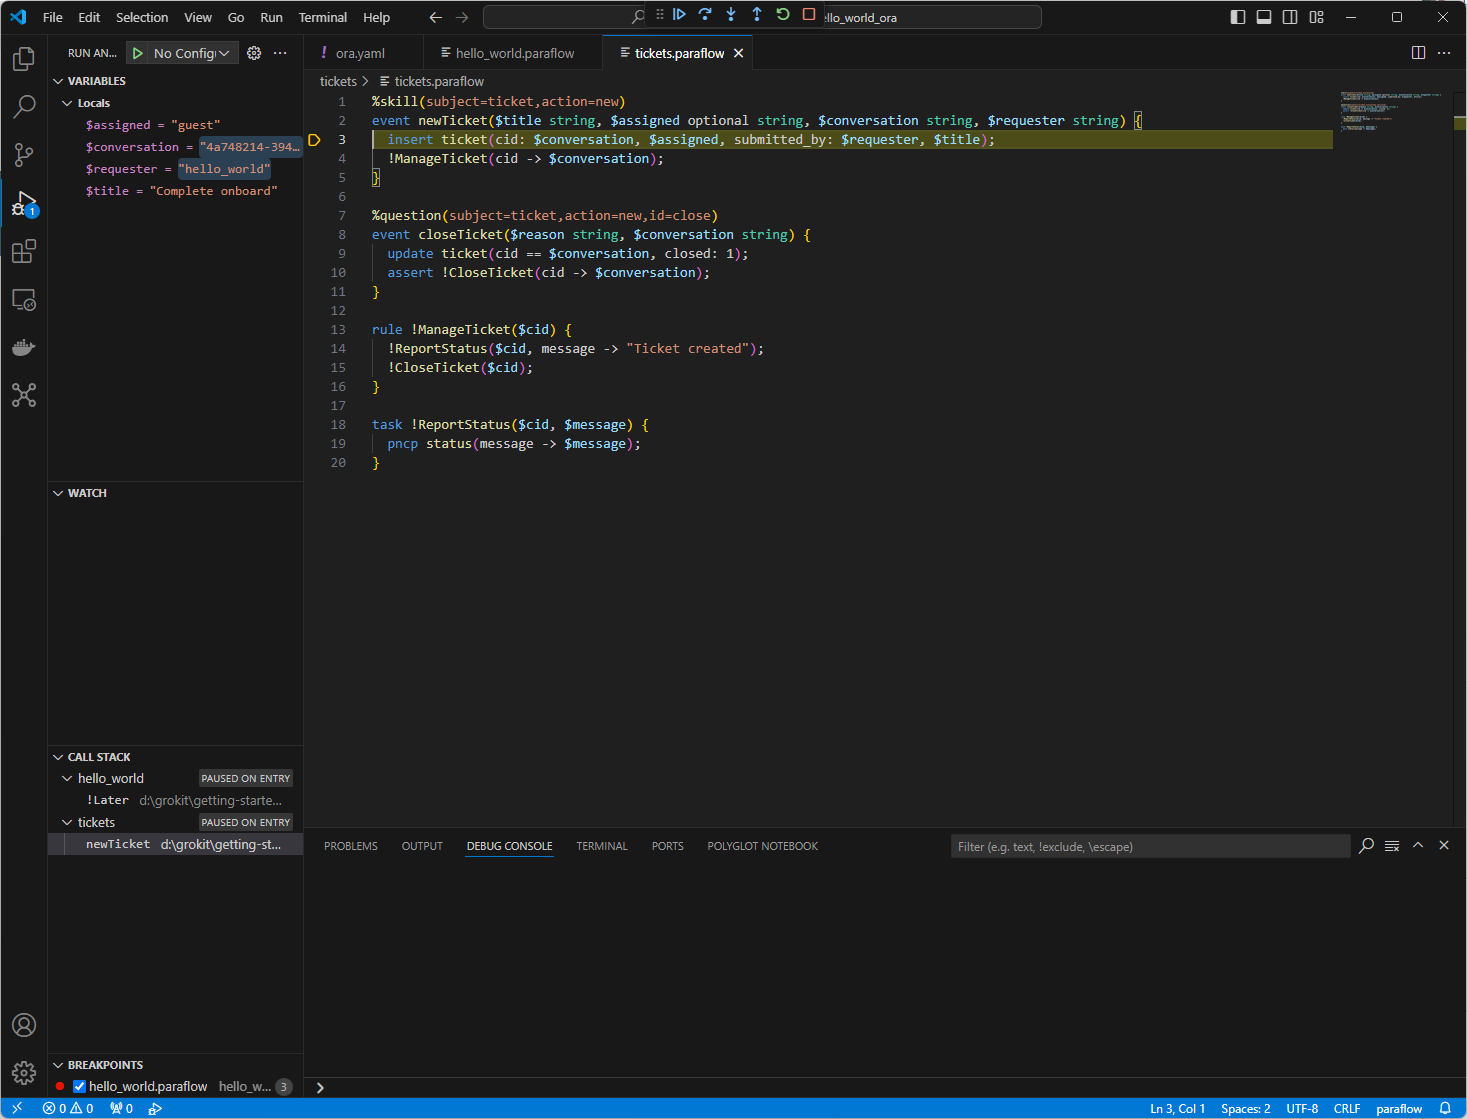
The screenshot below illustrates the debugger paused at a breakpoint in a sample multi-actor system:
For general usage instructions, refer to Visual Studio Code’s official Debugging Documentation. While the debugging experience aligns with standard VS Code practices, the following notes highlight key aspects specific to Paraflow:
- Multi-Actor Call Stacks: In multi-actor systems, the debugger displays separate call stacks for each actor (e.g.,
hello_worldandticketsin the screenshot). This reflects their independent execution. The Call Stack view shows the state of all actors simultaneously. To inspect an actor’s local variables, select its name in the Call Stack view, and review them in the Variables view. - Stepping Through Skill Requests: When stepping over a PNCP request in Paraflow, the debugger typically pauses at the corresponding event statement in the receiving actor. Execution continues within that actor until its logic completes.
- Switching Between Actors: While stepping through one actor, you can switch to another paused actor. In the Call Stack view, hover over the desired actor’s name to reveal control icons. Click the step icon to single-step that actor instead of continuing with the current one.